
基于geopandas绘制地图及图面整饰
前言
输入数据:
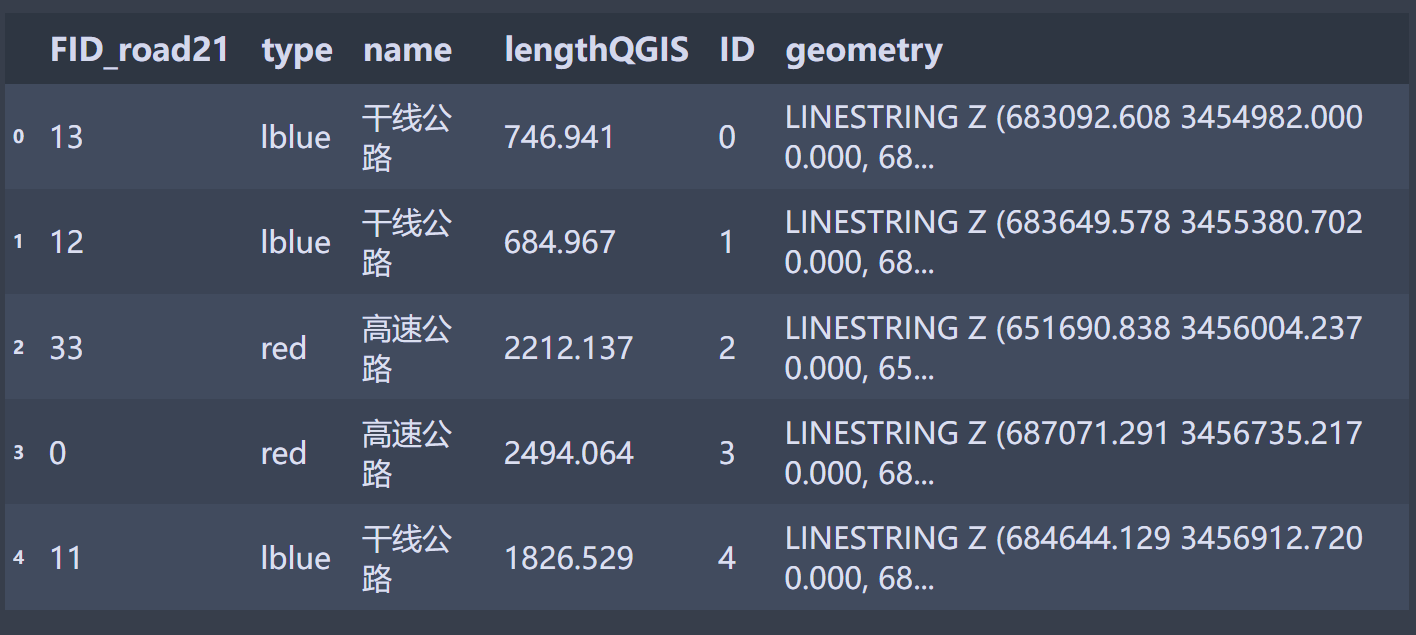
- 经QGIS/ArcGIS处理的路网矢量线数据
road21Final.shp - 城市底图矢量面数据
实现目标:
- 将数据处理从osmnx库需要的格式
- 利用osmnx库进行基本的指标求解
- 保存包含了指标信息的数据
- 地图可视化
相关知识点:
- momepy
- osmnx
- geopandas
绘图准备
导入包
import pandas as pd |
设置中文显示
plt.rcParams['font.sans-serif'] = ['SimHei'] # 指定默认字体 |
读取数据
s21="basic/road21Final.shp" |
数据处理
几个痛点
将LINESTRING Z 转换为LINESTRING:
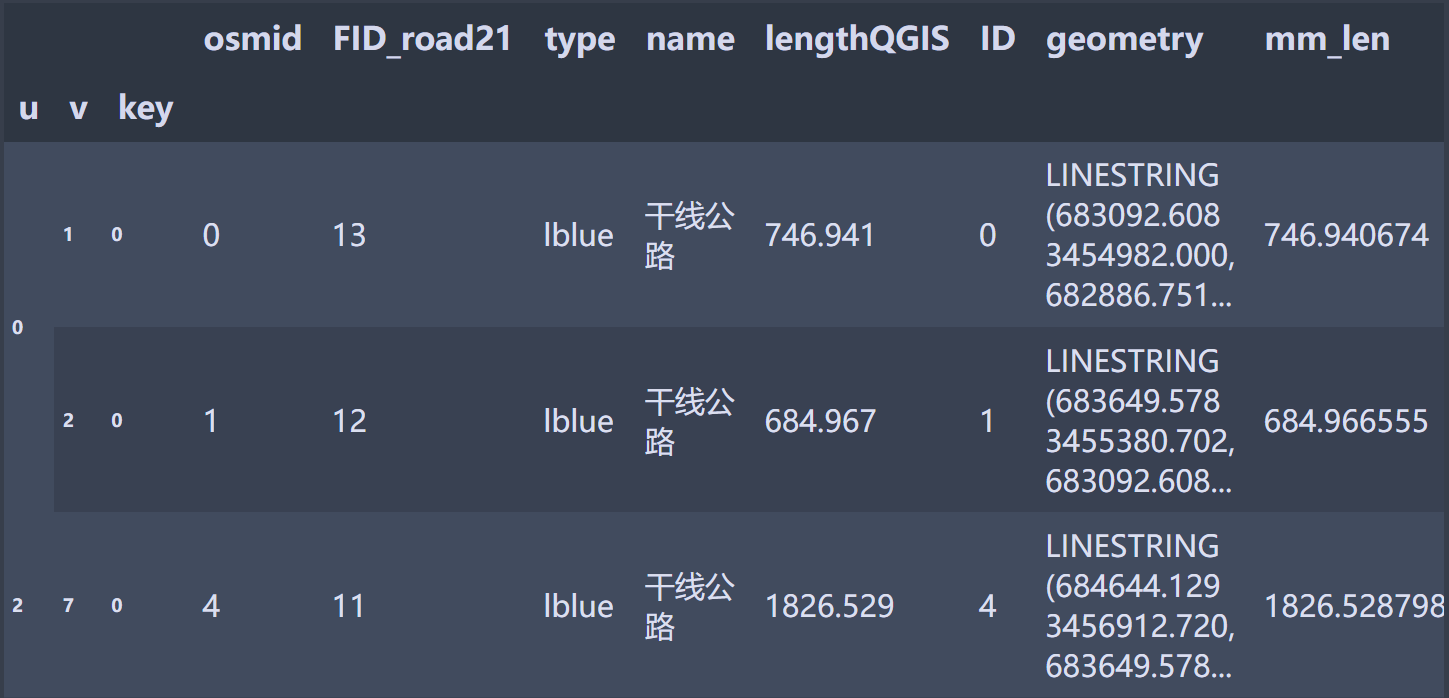
shapely.ops.transform将数据结构调整为osm路网结构数据,方便后续调用函数进行指标求解
数据索引的设置
处理流程
集成数据处理函数
# streets: geopandas直接读取的矢量路网数据 |
数据处理
处理结果
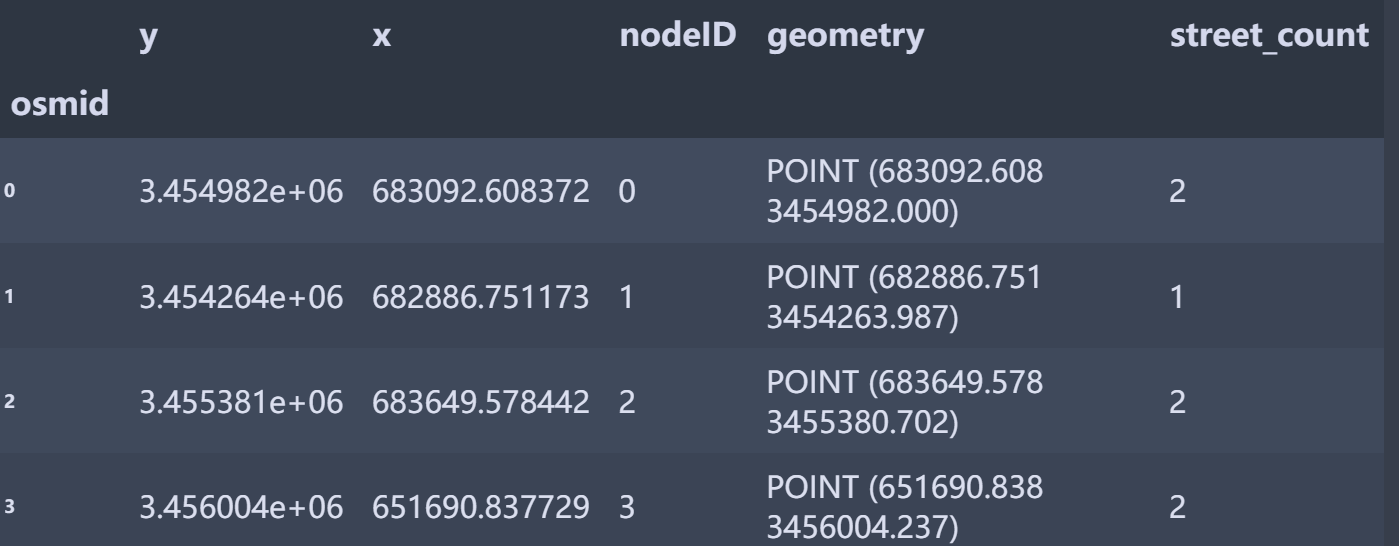
nodes
edges
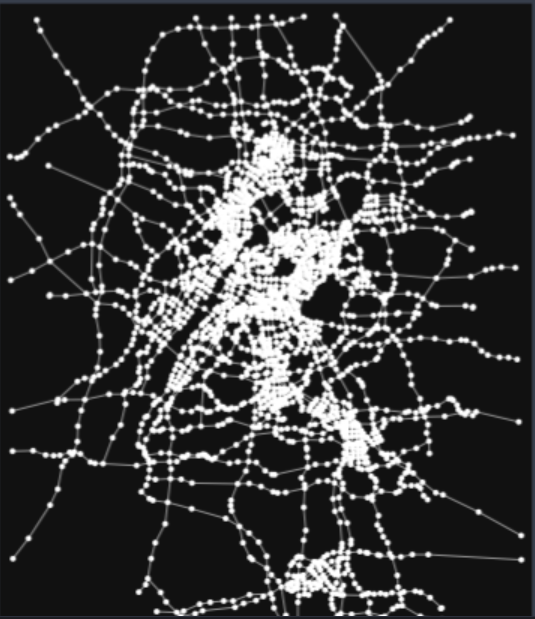
绘图验证
G = ox.graph_from_gdfs(nodes, edges) |
G.graph |
{‘crs’:
Name: WGS 84 / UTM zone 50N
Axis Info [cartesian]:
- E[east]: Easting (metre)
- N[north]: Northing (metre)
Area of Use:- name: Between 114°E and 120°E, northern hemisphere between equator and 84°N, onshore and offshore. Brunei. China. Hong Kong. Indonesia. Malaysia - East Malaysia - Sarawak. Mongolia. Philippines. Russian Federation. Taiwan.
- bounds: (114.0, 0.0, 120.0, 84.0)
Coordinate Operation:- name: UTM zone 50N
- method: Transverse Mercator
Datum: World Geodetic System 1984- Ellipsoid: WGS 84
- Prime Meridian: Greenwich}
指标求解
osmnx中的基本指标
# nary_union包含所有地理实体的集合体,convex_hull求凸包,来自于geopandas |
‘n’: 1929,节点的数量
‘m’: 4945, 边的数量
‘k_avg’: 5.127008812856403, 平均节点度(包括了入度和出度)
‘intersection_count’: 1706, 交叉点数量
‘streets_per_node_avg’: 3.0031104199066876,无向图中,每个节点连接的街道数目(边)的平均值
‘streets_per_node_counts’: {0: 0, 1: 223, 2: 12, 3: 1246, 4: 432, 5: 16},无向图中,连接到一个节点的街道数目:这个数字下的街道数目一共有多少
‘streets_per_node_proportion’: {0: 0.0,
1: 0.11560393986521514,
2: 0.006220839813374806,
3: 0.6459305339554173,
4: 0.223950233281493,
5: 0.00829445308449974},无向图中,对应的改成了占比
‘edge_length_total’: 774358.6850000017,米制的所有边长度的总和
‘edge_length_avg’: 156.59427401415604,上面的均值
‘street_length_total’: 486759.9220000005,在无向图中,米制的所有边长度的总和
‘street_length_avg’: 171.636079689704,上面的均值
‘street_segments_count’: 2836,无向图中,边的数量
‘node_density_km’: 35.29736508882025,平方千米下的,面积除以n
‘intersection_density_km’: 31.21685061769173,平方千米下的,面积除以intersection_count
‘edge_density_km’: 14169.425201733446,km下的,edge_length_total divided by area
‘street_density_km’: 8906.86504792104,km下的,street_length_total divided by area
‘circuity_avg’: 2.0995288875627176e-05,每个边的节点之间最大圆环距离,除以,边的总长度
‘self_loop_proportion’: 0.0008088978766430738,表示proportion of edges that have a single node as its endpoints (ie, the edge links nodes u and v, and u==v)
‘clean_intersection_count’: 8906.86504792104,表示number of intersections in street network, merging complex ones into single points
‘clean_intersection_density_km’: 23.29369920065743,km下的,clean_intersection_count divided by area
# 格式优化 |
数据保存
import os |
地图可视化
细节调整
 微信
微信 支付宝
支付宝